Documentation Index
Fetch the complete documentation index at: https://handbook.fiddler.ai/llms.txt
Use this file to discover all available pages before exploring further.
What You’ll Learn
In this guide, you’ll learn how to:- Set up a Fiddler application for monitoring Strands agents
- Install and configure the Strands Agents SDK
- Instrument Strands agents with automatic telemetry
- Use helper functions to add custom metadata
- Verify monitoring is working correctly
- Troubleshoot common integration issues
Prerequisites
Before you begin, ensure you have:- Fiddler Account: An active account with access to create applications
-
Python 3.10+: Verify your version:
-
Strands Agents SDK: Install the SDK (includes Strands agents and OpenTelemetry):
-
OpenAI API Key: For running the example agent:
If you prefer using a notebook, download it directly from GitHub or open it in Google Colab to get started.
Create a Fiddler Application
- Sign in to your Fiddler instance
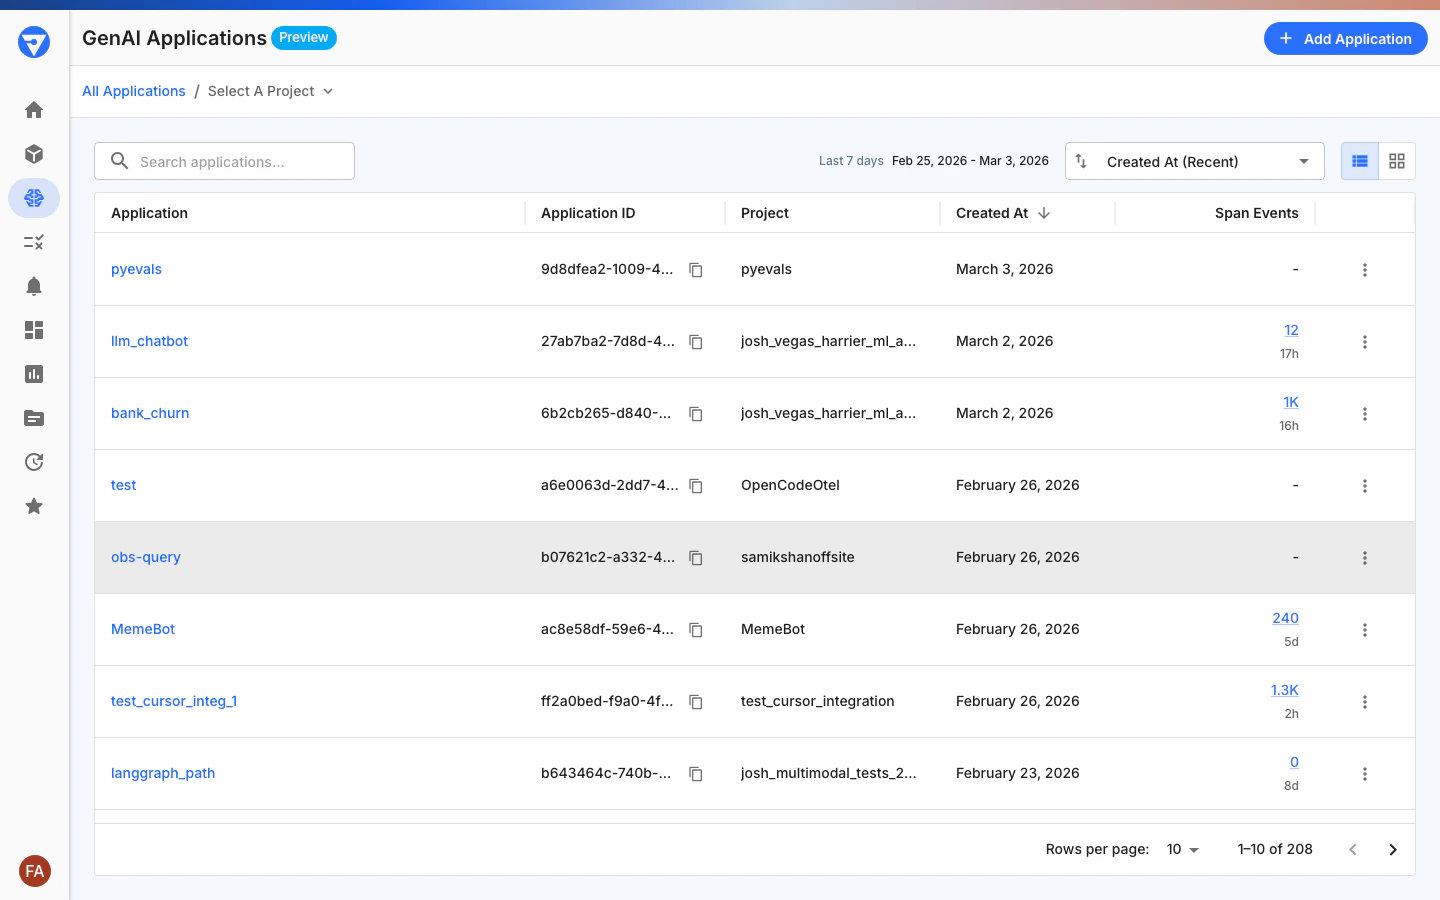
- Navigate to GenAI Applications in the left sidebar
- Click Add Application
- Enter the application details:
- Name:
strands-agent-monitoring - Project: Select a project from the dropdown or press Enter to create a new one
- Name:
- Click Create and copy the Application UUID (you’ll need this for configuration)
Configure Environment Variables
Set up the required environment variables for Fiddler integration. Replace the placeholder values with your actual credentials.Instructions for generating or retrieving your personal access token can be found in the Access guide.
Tip: Save these environment variables in a
.env file for easy reuse:Set Up Strands Telemetry and Instrumentation
Now configure the Strands telemetry system with automatic Fiddler instrumentation using the SDK.Create Configuration Breakdown:
agent_monitoring.py:- Console Exporter: Prints traces to terminal for debugging
- OTLP Exporter: Sends traces to Fiddler via OpenTelemetry Protocol
- StrandsAgentInstrumentor: Automatically instruments agents with proper attribute propagation and Fiddler integration
- Injects logging hooks into Strands agents
- Propagates agent attributes (name, ID, system prompt) to all child spans
- Processes spans with Fiddler-specific enhancements
- Handles all OpenTelemetry complexity behind the scenes
Create and Instrument Your Agent
With telemetry configured, create a Strands agent that’s fully instrumented for Fiddler monitoring.Add to Run your instrumented agent:
agent_monitoring.py:Verify Monitoring in Fiddler
After running your agent, verify that traces are appearing in Fiddler.
- Navigate to your application in Fiddler
- Click on the Traces tab
- You should see traces from your agent executions
- Click on a trace to view detailed span information
- Verify that agent attributes are present on spans (these are set automatically by the SDK):
gen_ai.agent.name— optional, but if present should appear on all spans in the tracegen_ai.agent.id— optional, but if present should appear on all spans in the trace
- ✅ Traces appear within 30 seconds of agent execution
- ✅ Parent and child spans are properly linked
- ✅ Agent attributes (
gen_ai.agent.name,gen_ai.agent.id) appear consistently across all spans - ✅ Tool calls are captured as separate spans
- ✅ System prompts are visible in trace metadata
Troubleshooting
Traces Not Appearing in Fiddler
Issue: No traces show up after running your agent. Solutions:-
Verify environment variables:
-
Check network connectivity:
-
Validate authentication:
- Ensure your access token is valid and not expired
- Verify Application UUID matches your Fiddler application
-
Review console exporter output:
- Check the terminal for trace output
- Look for error messages in console logs
Missing Agent Attributes on Child Spans
Issue: Tool calls and sub-spans don’t have agent context. Solutions:-
Verify SDK instrumentation is enabled:
-
Check instrumentation status:
-
Add custom attributes using helper functions:
OTLP Export Errors
Issue: Error messages about OTLP export failures. Solutions:-
Check endpoint format:
-
Verify headers format:
-
Test with a minimal example:
Performance Issues
Issue: Agent response times are slower after adding monitoring. Solutions:-
Use batch span processor (already default in StrandsTelemetry):
-
Disable console exporter in production:
-
Adjust sampling rate if needed:
Configuration Options
Basic Configuration
For most use cases, the basic configuration is sufficient:Adding Custom Metadata with Helper Functions
The SDK provides helper functions to enrich your traces with custom business context:set_conversation_id(agent, conversation_id)- Track multi-turn conversationsset_session_attributes(agent, **kwargs)- Add session-level business contextset_span_attributes(obj, **kwargs)- Add attributes to models, tools, or agentsset_llm_context(model, context)- Add background information for LLM interactionsget_conversation_id(agent)- Retrieve conversation IDget_session_attributes(agent)- Retrieve session attributesget_span_attributes(obj)- Retrieve span attributesget_llm_context(model)- Retrieve LLM context
Advanced Configuration
For production deployments with custom resource metadata and batch settings:- Custom Resource: Add service metadata for better organization
- Batch Settings: Tune for your throughput requirements
- Timeout Configuration: Adjust for network conditions
- Environment Tagging: Separate dev/staging/prod traces
- SDK Integration: Works seamlessly with custom OpenTelemetry configurations
Multi-Agent Configuration
For systems with multiple agents:- ✅ Distinct agent identification in traces
- ✅ Separate performance metrics per agent
- ✅ Clear visualization of agent interactions
- ✅ Easier debugging of complex workflows
Next Steps
Now that you have Strands agents integrated with Fiddler, explore these advanced capabilities:Advanced Observability and Evaluation
- Experiments: Score and enrich your agent telemetry