Documentation Index
Fetch the complete documentation index at: https://handbook.fiddler.ai/llms.txt
Use this file to discover all available pages before exploring further.
Analytics Charts
There are three supported analytics chart types:- Performance Analytics — Visualize various performance metrics tailored to different task types, such as confusion matrices, prediction scatterplots, and more.
- Feature Analytics — Analyze the behavior and relationships between features, helping to identify patterns and insights within the data, using feature distribution, feature correlation, and correlation matrix charts.
- Metric Card — Display a single numeric representation of a metric, offering a concise overview of performance, data quality, data integrity, or custom metrics on a card.
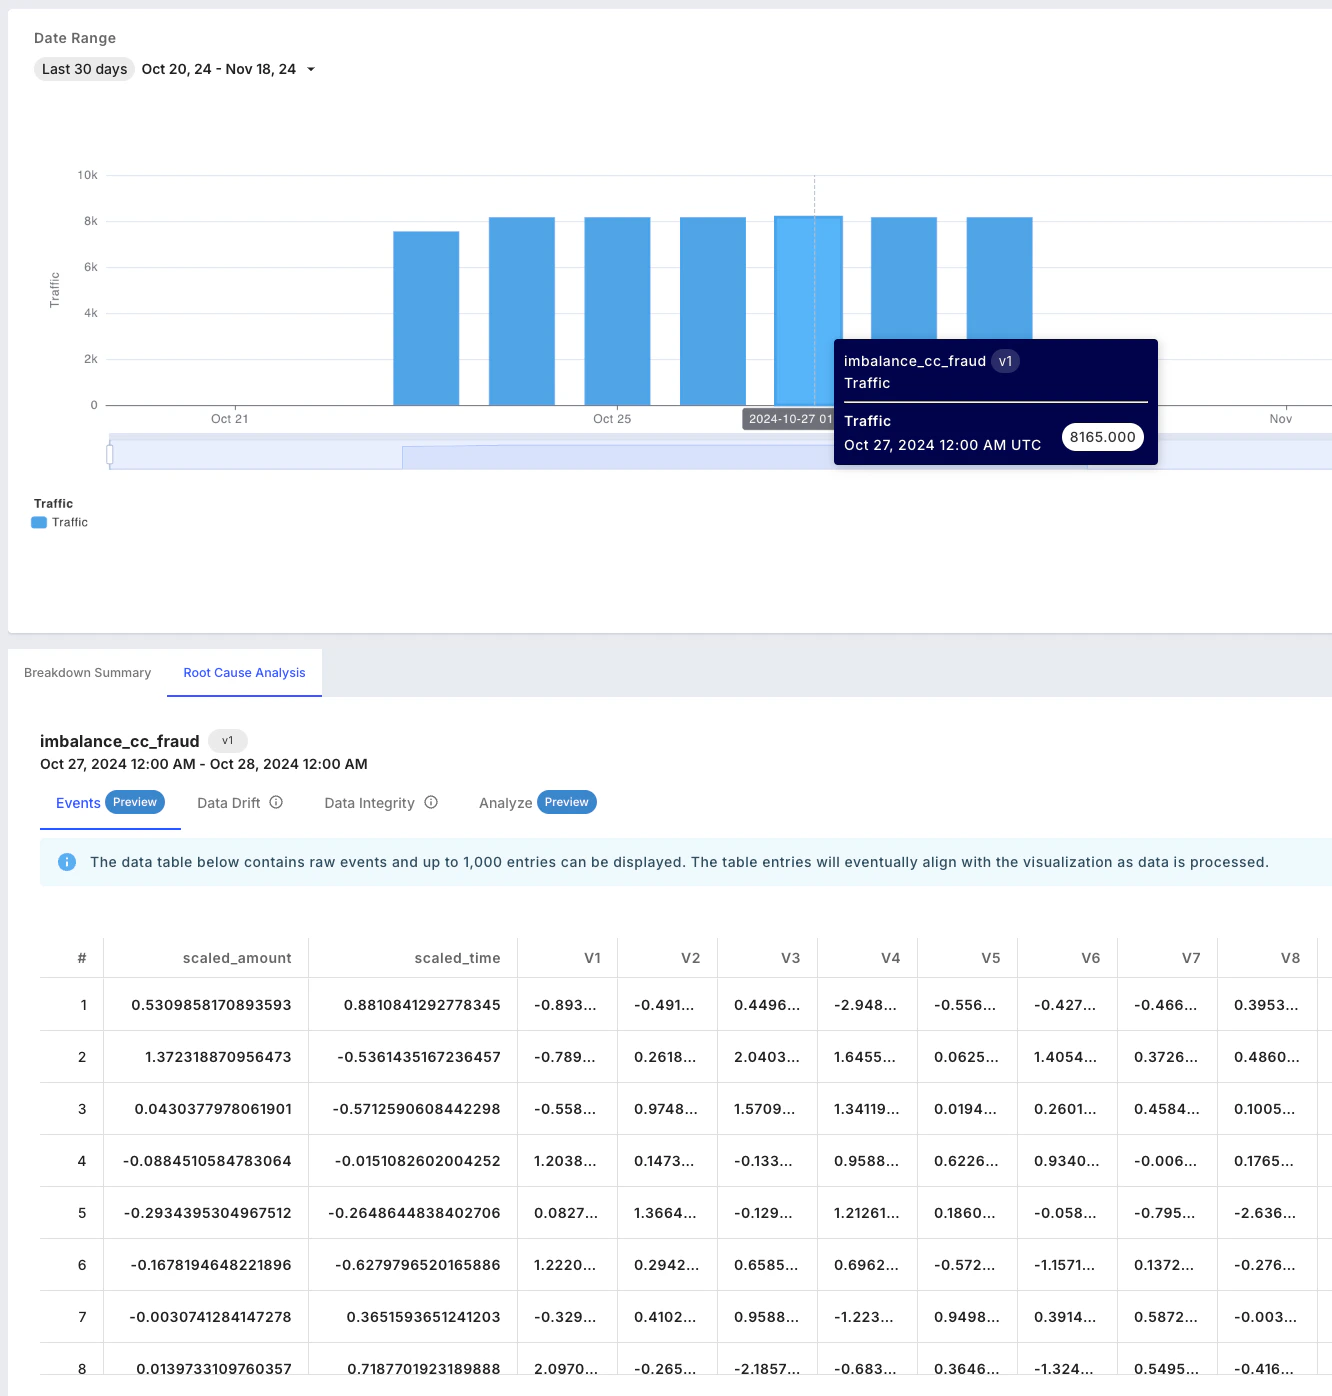
Root Cause Analysis
The Root Cause Analysis (RCA) experience consists of four parts, all based on the FQL segment and time range provided in the monitoring chart:- Events — Browse a sample of 1,000 events.
- Data Drift — View a breakdown of drift for your features, along with prediction drift impact.
- Data Integrity — Review a summary of data integrity violations, including counts across range, type, and missing value issues.
- Analyze — View performance and feature analytics charts.